Tag: CPM Floors

  • How to Fix Low Fill Rate in Google Ad Manager (GAM)

    How to Fix Low Fill Rate in Google Ad Manager (GAM)

    How to Fix Low Fill Rate in Google Ad Manager (GAM)

    If your revenue drops despite steady traffic, the first metric to audit is your Fill Rate. A low fill rate indicates that your site is generating ad requests that aren’t converting into impressions. Essentially, you are leaving money on the table.

    What Is Fill Rate?

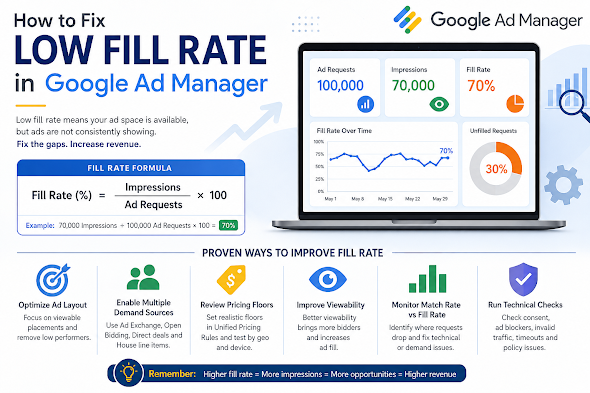
    Fill rate is the percentage of ad requests that result in a displayed ad.

    Example: If you have 100,000 ad requests but only 70,000 impressions, your fill rate is 70%. While “healthy” rates vary by niche, most publishers aim for 80–95% on standard display inventory.


    5 Common Culprits Behind Low Fill Rate

    ReasonThe Impact
    Low Geo DemandTraffic from Tier 3 countries often lacks the advertiser depth to fill every request.
    Ad Unit OverloadToo many ad units on one page dilute bid competition and slow down page rendering.
    Restrictive SizesUsing non-standard sizes (e.g., 200×200) limits the pool of available creative assets.
    Aggressive FloorsSetting CPM floors too high rejects bids that would otherwise have filled the slot.
    Technical LatencyIf the page loads too slowly, the user may scroll past or leave before the ad renders.

    Strategic Solutions to Boost Fill

    1. Optimize Pricing Rules (UPRs)

    Check your Unified Pricing Rules in GAM. If your floors are set based on peak seasonal demand (like Q4), they may be too high for slower periods.

    • Action: Experiment with “Floor Shifting.” Lower floors for specific low-demand geographies or devices to capture “long-tail” revenue.

    2. Diversify Your Demand Stack

    Don’t put all your eggs in the AdSense/AdX basket. High-growth publishers use a multi-layered approach:

    • Header Bidding: Bring in Prebid.js to force AdX to compete with external SSPs.
    • Open Bidding: Enable Google’s server-to-server demand.
    • Backfill/House Ads: Ensure you have a “catch-all” line item (like a self-promotion or a low-priority ad network) to ensure 0% of requests go to waste.

    3. Focus on “Signal” over “Volume”

    Advertisers bid more—and more often—on high-viewability inventory.

    • Lazy Loading: Only request the ad when the user is about to scroll to it. This reduces “unfilled” requests from the bottom of the page that never get seen.
    • Ad Refresh: If using auto-refresh, ensure it only triggers when the ad is in view.

    4. Standardize Ad Sizes

    Enable Multi-Size Pricing. Instead of just requesting a 300×250, allow the slot to accept 300×600 or 320×50. Increasing the number of eligible creatives for a single slot naturally drives up the fill rate.


    Technical Troubleshooting Checklist

    If your demand looks healthy but fill is still low, check for these “silent killers”:

    • CMP Issues: If your Consent Management Platform isn’t firing correctly, Google cannot serve personalized ads (or any ads) in regulated regions like the EU (GDPR).
    • app-ads.txt / ads.txt: Ensure your file is reachable and up to date. Missing entries will lead to immediate bid rejection.
    • Mismatched Line Items: Check if your line item targeting (Geo, Device, Key-values) is too narrow for the traffic you are receiving.
    • Rendering Timeouts: If your Header Bidding timeout is too short, the auction might close before bids arrive.


    Summary: When Should You Worry?

    A temporary dip during the start of a quarter (January, April, July, October) is normal as advertiser budgets reset. However, a sustained drop usually points to a pricing mismatch or a technical bottleneck.

    The Goal: Optimization isn’t about adding more ads; it’s about making your existing ad slots more “eligible” for the highest number of buyers possible.

  • The “Traffic vs. Revenue” Paradox: Why Your Ad Revenue Dropped (Despite Stable Traffic)

    The “Traffic vs. Revenue” Paradox: Why Your Ad Revenue Dropped (Despite Stable Traffic)

    The “Traffic vs. Revenue” Paradox: Why Your Ad Revenue Dropped (Despite Stable Traffic)

    Seeing your revenue dip while your traffic remains steady is a frustrating puzzle for any publisher. On the surface, it feels like a technical glitch—but in the world of modern ad tech, traffic is only one variable in a complex equation.

    Earnings are driven by a mix of advertiser demand, technical performance, and audience composition. If your “total visitors” count is the only metric you’re watching, you’re missing the forest for the trees.

    1. Macro-Economic & Seasonal CPM Shifts

    The most common culprit isn’t your site—it’s the market. CPMs (Cost Per Mille) are dictated by advertiser appetite, which fluctuates based on:

    • The “January Slump”: Following the high-spend holiday season (Q4), advertisers slash budgets in Q1, leading to a universal drop in CPMs.
    • Economic Headwinds: During inflation or recession scares, brands pivot from “brand awareness” (display ads) to “direct response” (search/social), lowering the auction pressure on your site.

    2. Shifts in “Audience Quality”

    Not all pageviews carry the same weight. A shift in where your traffic comes from can decimate your RPM (Revenue Per Mille):

    • Geography: 1,000 visitors from the US or UK (Tier 1) are often worth 5–10x more than 1,000 visitors from emerging markets due to advertiser competition.
    • Source: Organic search visitors usually have higher “intent” and stay longer than “viral” social media traffic, making them more valuable to bidders.

    3. The Viewability Trap

    Advertisers are increasingly savvy; they don’t just pay for “loaded” ads, they pay for seen ads.

    If your Viewability Score (the % of ads that are on-screen for at least one second) drops below 50–60%, premium bidders will flee. Common causes include:

    • Slow-loading ad units (the user scrolls past before the ad renders).
    • Content shifts (CLS) that push ads out of the viewport.
    • Lazy-loading configurations that are too aggressive.

    4. Technical Friction & “Signal Loss”

    The “behind-the-scenes” tech can often break without affecting the front-end user experience:

    • Consent Management (CMP) Failures: If your cookie consent banner isn’t firing correctly, you lose the ability to serve personalized ads, which can tank CPMs by 50% or more.
    • Privacy Updates: Increased tracking prevention in browsers like Safari and Firefox (and the slow fade of third-party cookies) means less data for advertisers, resulting in lower bids.
    • Ad Blockers: A tech-savvy audience shift can result in more “ghost” traffic—users who show up in your analytics but never request an ad.

    5. Inventory and Auction Pressure

    If you use Header Bidding or a Unified Auction, your revenue relies on competition.

    • Bidder Health: If one of your major SSPs (Supply Side Platforms) has a technical issue or pauses their spend on your domain, the lack of competition allows other bidders to win your inventory at lower prices.
    • Floor Prices: If you’ve set your “Hard Floors” too high, your fill rate will tank. If they are too low, you may be “leaving money on the table.”

    How to Diagnose the Drop: A Checklist

    Before panicking, run these reports in your Ad Server (GAM, AdSense, etc.) and compare the last 30 days to the previous period:

    Metric to CheckWhat it Tells You
    eCPM by GeographyDid your high-value US traffic drop while low-value traffic grew?
    Fill RateAre you failing to sell the inventory you have?
    Viewability %Are your ads loading too slowly or in the wrong places?
    Bid DepthIs the number of advertisers competing for your slots decreasing?
    CPM by DeviceIs a specific mobile update or layout change hurting mobile revenue?