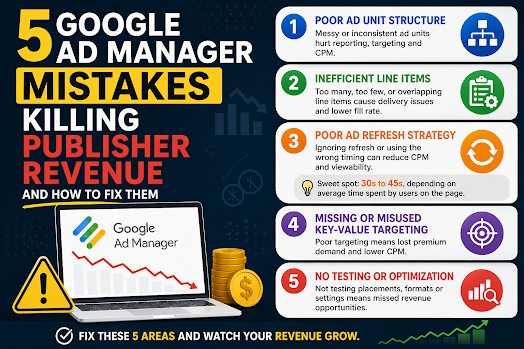
5 Google Ad Manager Mistakes That Are Killing Publisher Revenue (And How to Fix Them)

Many publishers assume low ad revenue is caused by traffic drops or weak SEO.
But in reality, most revenue loss comes from poor Google Ad Manager (GAM) configuration and optimization mistakes that quietly reduce performance.
Even experienced publishers overlook these issues.
In this guide, we’ll break down the 5 most common GAM mistakes that hurt publisher revenue and how to fix them using real-world ad operations logic.
1. Poor Google Ad Manager Ad Unit Structure
One of the most common Google Ad Manager mistakes is a messy or inconsistent ad unit structure.
Many publishers create ad units like:
- homepage_banner_1
- sidebar_ads
- mobile_ad_random123
While this may seem harmless, it creates serious scaling issues.
Why this hurts publisher revenue:
- weak inventory segmentation
- poor reporting accuracy
- inefficient programmatic targeting
- reduced buyer understanding of inventory
SEO & monetization impact:
A poorly structured GAM setup reduces demand competition, which directly lowers CPM and overall revenue.
Fix:
Use a structured naming system:
Format:
site_section_placement_device
Example:
news_home_top_leaderboard_desktop
This improves:
- reporting clarity
- targeting precision
- ad demand optimization
2. Inefficient Line Item Configuration in GAM
Another major Google Ad Manager mistake is improper line item setup.
Publishers often:
- create too many overlapping line items
- or rely on a single demand source
Why this reduces revenue:
- internal competition confusion
- inefficient ad delivery prioritization
- loss of high-value impressions
Result:
GAM cannot properly allocate impressions, leading to lower yield.
Fix:
- separate direct and programmatic demand clearly
- avoid redundant line items
- define clear priority hierarchy in GAM
A clean structure improves:
- fill rate
- CPM stability
- demand competition efficiency
3. Poor Ad Refresh Strategy in Google Ad Manager
Ad refresh is one of the most misunderstood GAM optimization tools.
Many publishers either:
- don’t use ad refresh at all
- or implement overly aggressive refresh cycles
Why this hurts revenue:
- aggressive refresh lowers CPM (buyers devalue impressions)
- no refresh misses long-session monetization opportunities
- poor timing reduces viewability performance
Best practice ad refresh strategy:
The optimal approach is to balance refresh timing based on user engagement and page behavior.
A practical ad refresh range is 30 to 45 seconds, depending on average time spent on page and viewability conditions.
However, this is not a fixed rule.
Better optimization approach:
- Use longer refresh intervals for short-session pages
- Apply 30–45s refresh only for high engagement content
- Prioritize viewable refresh triggers over timer-based refresh alone
This ensures:
- higher CPM stability
- better user experience
- improved ad viewability scores
4. Missing or Misused Key-Value Targeting in GAM
Key-values are a powerful but often underused feature in Google Ad Manager.
Common mistakes include:
- not using key-values at all
- overcomplicating setup
- not aligning with demand partners
Why this reduces revenue:
Without proper segmentation, publishers lose:
- audience targeting precision
- premium demand access
- higher CPM opportunities
Fix:
Start with simple key-values:
- device type (mobile / desktop)
- content category
- geographic region
Then expand only when necessary.
Proper key-value usage improves:
- programmatic targeting
- demand matching efficiency
- revenue per impression
5. No Testing or Optimization Strategy in GAM
Many publishers treat Google Ad Manager as a “set and forget” system.
This is a major revenue killer.
Without testing, you miss:
- optimal ad placements
- best-performing formats
- highest RPM configurations
Even small changes can significantly impact revenue.
Examples of high-impact tests:
- ad placement position changes
- refresh timing adjustments
- layout density optimization
- format mix comparison
Fix:
Treat GAM as a continuous optimization system:
- run placement tests
- monitor RPM changes
- track viewability performance
- adjust based on data, not assumptions
📊 Final Thoughts: Why Publishers Lose Revenue in GAM
Most publishers don’t lose revenue because of traffic issues.
They lose revenue because of:
- poor GAM structure
- inefficient setup
- lack of optimization strategy
The good news is that these are fully fixable without increasing traffic.
In many cases, proper Google Ad Manager optimization alone can significantly increase:
CPM stability
RPM (Revenue per Mille)
fill rate